A variety of technologies have been created to help people come up with a range of ideas. There are electronic journals embedded into digital laboratories. There are online technologies that enable people to take notes on-the-go and keep the notes in the “cloud,” so they can access their ideas with a variety of devices from anywhere with connectivity to the Internet. The visualization software of Microsoft Visio has a “Brainstorming Diagram” tool that offers a spatialized (sometimes called a “bubble diagram”) type of brainstorming.
To sample this tool, open Microsoft Visio 2010. Go to open a New file. Under the Business templates, you will find a Brainstorming Diagram.
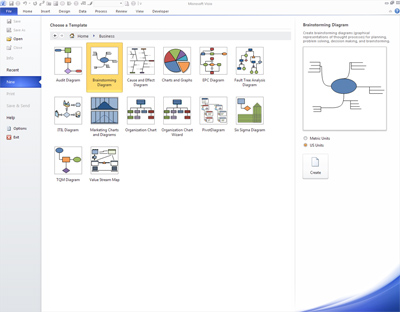
Click the Create button at the right.
The following workspace will appear. The grid area is the active space that you can build in. (You can change the workspace by going to the Design button in the Menu Bar and then clicking on Orientation — to choose between landscape and portrait — and on Size to set the paper size from more than a dozen size selections.)

To build a brainstorming shape, drag the oval-shaped main topic onto the main workspace.
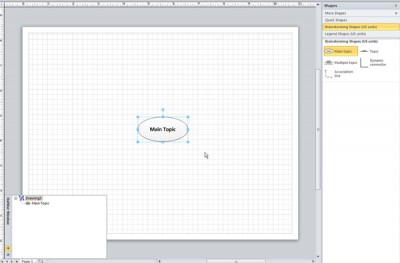
Double-click the text in order to input the topic name. You can reshape the object by clicking on it. When the blue shape overlay is on the object, the shape can be resized in any direction by pulling on the marked blue squares. Dragging on a straight edge will move the object.
To add multiple topics, drag the Multiple topic shape into the work area.
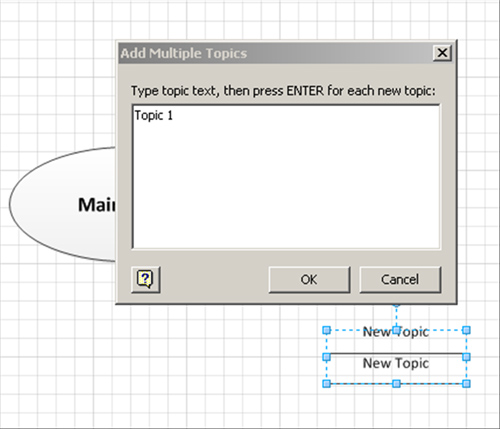
Type in as many topics as you want for that cluster of ideas.
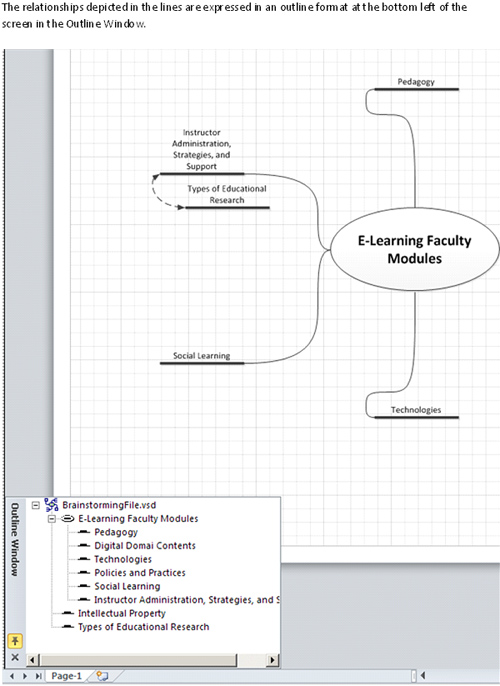
To connect various elements, you can use a dynamic connector to show direct subordinate relationships between the main topic and the connected topics. An Association Line shows a lesser or more distant connection. Just drag the lines onto the workspace, and connect the relevant ends to the various objects. The following image shows a Main Topic connected by an association with a topic.

The following is a quick brainstorm just to demonstrate how the hierarchy of this brainstorm reflects in the outline and in the brainstorming visual.

The relationships depicted in the lines are expressed in an outline format at the bottom left of the screen in the Outline Window. This textual outline may help keep elements and relationships straight if the visual brainstorming diagram gets very complicated.
Save the file by going to File, then Save. Once your file has been saved as a .vsd (Visio diagram) file, you can output the saved file in any number of formats. Go to the Menu Bar, click File, then Save As, and then select the proper file type from the drop-down menu.
- If the image will be used on a website, the image may be saved as a .jpg or .gif or .png.
- If the image will be used in a publication, it may be saved as a .tif file.
- An image may be saved as a .pdf if the image will be used as a stand-alone file with other text.

The file may now be attached to email and shared with colleagues via email, virtual work areas, or learning / course management systems.