To give a sense of the various types of graphs that may be “drawn” from data using NodeXL, this entry highlights some of the different types of graphs. This entry will be created using a data extraction from Twitter. All the graphs here will be taken from the same data set; the only differences in visualizations will come from the layout algorithms. [This data crawl—more on this in later entries—was a 2-degree crawl of Pulitzer Prize-winning author Laurie Garrett’s (Laurie_Garrett) user network on the microblogging site Twitter, with an ego neighborhood limit of 100 persons (alters). Her formal account has 3,768 Tweets, 228 following, and 2,558 followers.)
The Data Extraction
This data extraction required an over-night crawl because of Twitter-imposed limits per its application programming interface (API) and the size of the electronic social network.
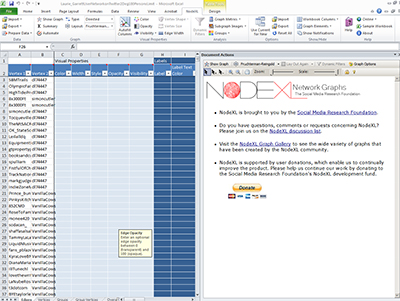
The initial capture of the network looks like this. In the Vertex 1 column are the names of the various accounts. Vertex 2 refers to the “alter” in the ego neighborhood (the direct ties) of the Laurie_Garrett account. Because this capture was limited to 100 persons, this only captured a small part of the network.
After this capture, the Graph Metrics and Groups (clustering) were calculated. Now that these data were placed into the Excel work sheets, various visualizations of this captured data are now possible. # types of graphs are made available through the current version of NodeXL. These data visualization algorithms are based on research work by statisticians and computer scientists.
The two main default algorithms are the Harel-Koren Fast Multiscale Layout Algorithm and the Fruchterman-Reingold force-based layout algorithm. The first requires plenty of computing capacity, and if a data set includes too many vertices and edges, the computer will pop up a notice of its inability to calculate the graph. The other layout algorithms seem to require less computing capacity and will output graphs more quickly.
Graph Metrics
The graph metrics are a summarization of the main characteristics of the particular electronic social network. A two-degree crawl involves the focal node (Laurie_Garrett), the direct ties to this account (the ego neighborhood consisting of a maximum of 100 alters), the ties between the “alters” (transitivity), and then the ego neighborhoods of the 100 selected alters. Each of the vertices (nodes) refers to an account on Twitter, whether that account consists of humans, robots, or cyborgs (an account shared by a human and a ‘bot that both Tweet).
From the data extraction, 25,631 vertices (nodes) were identified, with 33,443 unique edges (an indicator of inter-connectivity between the nodes). The maximum geodesic distance of this social network is 4 hops; said another way, connecting the two furthest nodes from each other requires four connectors with two intermediate nodes between the two most-distant nodes. The graph density is 5.17 or each node has approximately 5 other nodes connected to it.
|
Graph Metric |
Value |
|
Graph Type |
Directed |
|
|
|
|
Vertices |
25631 |
|
|
|
|
Unique Edges |
33443 |
|
Edges With Duplicates |
1344 |
|
Total Edges |
34787 |
|
|
|
|
Self-Loops |
0 |
|
|
|
|
Reciprocated Vertex Pair Ratio |
0.046651455 |
|
Reciprocated Edge Ratio |
0.089144204 |
|
|
|
|
Connected Components |
1 |
|
Single-Vertex Connected Components |
0 |
|
Maximum Vertices in a Connected Component |
25631 |
|
Maximum Edges in a Connected Component |
34787 |
|
|
|
|
Maximum Geodesic Distance (Diameter) |
4 |
|
Average Geodesic Distance |
3.931846 |
|
|
|
|
Graph Density |
5.16728E-05 |
|
Modularity |
Not Applicable |
|
|
|
|
NodeXL Version |
1.0.1.229 |
The Clauset-Newman-Moore grouping algorithm identified 73 clusters within this network. This indicates a highly diverse network.
Some Graph Visualizations
An attempt at the Harel-Koren Multiscale Layout Algorithm for this graph resulted in the following message about a lack of memory. To do fairly large computations, there has to be sufficient memory in the scratch disk. (There will be other examples of graphs created using the Harel-Koren Multiscale Layout Algorithm in following entries, so no further attempt will be made on this one.)

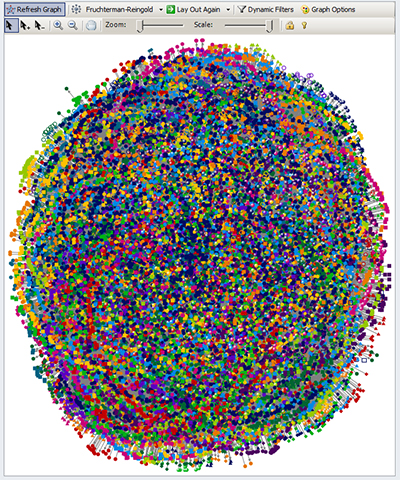
Fruchterman-Reingold
The Fruchterman-Reingold layout algorithm is the default layout algorithm. This defines each of the alters as its own network that overlap. Membership in each network is indicated by different shapes and colors of nodes or vertices for a very colorful layout.
The following photo album contains some of the various other visualizations: Circle (Ring Lattice Graph), Spiral, Horizontal Sine Wave, Vertical Sine Wave, Grid, Polar, Polar Absolute, Sugiyama, and Random.

The link to the photo album is available here.
An Overview of the Steps to Creating a Graph Visualization in NodeXL
The Excel work sheets and raw data exist to the left side of the work space. To the right is the graph pane, where visualizations are portrayed.
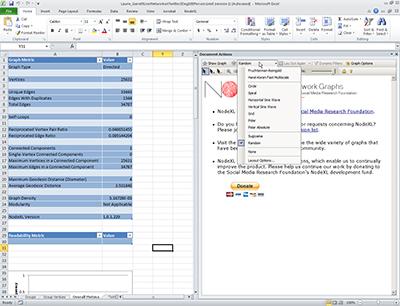
Click on the dropdown menu above the graph pane to select the type of visualization you want. Then click the “Show Graph” button next to it.
Final Note: NodeXL is a free and open-source tool that is available from Microsoft’s CodePlex site (which is a space for project hosting for open-source software), and it is sponsored by the Social Media Research Foundation .