Kansas State University

search

IT News

Tag: data tables

June 3: Exploring Microsoft Excel (Essentials)

Exploring Microsoft Excel (Essentials) training is scheduled 1:30-3:30 p.m. Friday, June 3 (Fri.), on Zoom.  

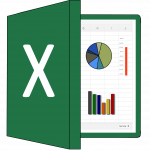
About Microsoft Excel

Microsoft Excel is the foremost spreadsheet program in use today.

It is commonly used to:

  • Conduct calculations
  • Clean data
  • Graph or plot data (to identify data patterns)
  • Create data visualizations (both static and interactive)
  • Apply visual styles to data tables and data visualizations
  • Create interactive data visualizations (interactive pivot tables, interactive dashboards with sliders, and others)
  • Create simple macros for continuing data handling (with Visual Basic programming language)
  • Process data for analytics in other software programs
  • Enable the share-ability of information
  • Access online survey data (in analyze-able format), and more…

Continue reading “June 3: Exploring Microsoft Excel (Essentials)”

July 16: Intro to NVivo

NVIVO
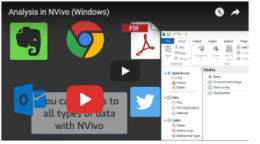
An “Intro to NVivo” training is scheduled from 1:30-3:30 p.m. Friday, July 16, for all faculty, graduate students, and staff who may be using this qualitative (and mixed methods, multimethods) data analysis tool. This session will occur on Zoom.

This presentation, which covers NVivo 12 Plus / NVivo (newest) basics, will address the following:

  • The basic parts of the NVivo 12 Plus interface
  • How to start and structure a research project (including a team project)
  • How to set up a project around a base language (Chinese/PRC, English/US, English/UK, French, German, Japanese, Portuguese/Brazil, and Spanish
  • How to ingest various multimedia file types (and curate heterogeneous and semi-structured digital data and digitized contents)
  • How to ingest some social media contents
  • How to begin manual and/or automated coding various media file types
  • How to run data queries in the tool and analyze resulting data visualizations (word clouds, word trees, matrices, geographical maps, bar charts, and others)
  • How to back up the .nvp / .nvpx project file

Continue reading “July 16: Intro to NVivo”

March 19: Intro to NVivo training

NVIVOAn “Intro to NVivo” training is scheduled from 1:30-3:30 p.m. Friday, March 19, for all faculty, graduate students, and staff who may be using this qualitative (and mixed methods, multimethods) data analysis tool.  This session will occur on Zoom.

This presentation, which covers NVivo 12 Plus / NVivo (newest) basics, will address the following:

  • The basic parts of the NVivo 12 Plus interface
  • How to start and structure a research project (including a team project)
  • How to set up a project around a base language (Chinese/PRC, English/US, English/UK, French, German, Japanese, Portuguese/Brazil, and Spanish
  • How to ingest various multimedia file types (and curate heterogeneous and semi-structured digital data and digitized contents)
  • How to ingest some social media contents
  • How to begin manual and/or automated coding various media file types
  • How to run data queries in the tool and analyze resulting data visualizations (word clouds, word trees, matrices, geographical maps, bar charts, and others)
  • How to back up the .nvp / .nvpx project file

Continue reading “March 19: Intro to NVivo training”

Oct. 16: Intro to NVivo

NVIVOAn “Intro to NVivo” training is scheduled from 1:30-3:30 p.m. Friday, Oct. 16, for all faculty, graduate students, and staff who may be using this qualitative (and mixed methods, multimethods) data analysis tool. This session will occur on Zoom.

This presentation, which covers NVivo 12 Plus / NVivo (newest) basics, will address the following:

  • The basic parts of the NVivo 12 Plus interface
  • How to start and structure a research project (including a team project)
  • How to set up a project around a base language (Chinese/PRC, English/US, English/UK, French, German, Japanese, Portuguese/Brazil, and Spanish
  • How to ingest various multimedia file types (and curate heterogeneous and semi-structured digital data and digitized contents)
  • How to ingest some social media contents
  • How to begin manual and/or automated coding various media file types
  • How to run data queries in the tool and analyze resulting data visualizations (word clouds, word trees, matrices, geographical maps, bar charts, and others)
  • How to back up the .nvp / .nvpx project file

Continue reading “Oct. 16: Intro to NVivo”