By Christopher “Chip” Redmond, Kansas Mesonet Manager, via Agronomy eUpdates
The forecast for the coming week consists of bitter cold air, the coldest of the 2023/2024 winter season thus far. However, the temperature does not always give the air that nip. The “feels like” temperature is also usually influenced by the wind. We call this the wind chill.
What is the wind chill?
When temperatures drop below 50oF and wind speeds are greater than five mph, the “Feels Like” temperature is lower than the actual temperature. Wind chill can be calculated in two ways: 1) using the chart below or 2) mathematically. Wind chill values decrease as the wind increases and/or the temperature decreases. This means that despite it being 0oF on a very cold morning when factoring in the wind (for example, 20 mph), it can feel like a much colder temperature (in this example, -22oF).
This colder “feels like” temperature can make you feel chilled quicker and lead to other problems such as frostbite much quicker. Exposure time estimations of frostbite issues at 0 degrees F with no wind is 30 minutes, while 0oF and 55 mph winds are less than 10 minutes of exposure. Wind chills can be determined by the following chart from the National Weather Service (https://www.weather.gov/safety/cold-wind-chill-chart):

Where can you access wind chill data?
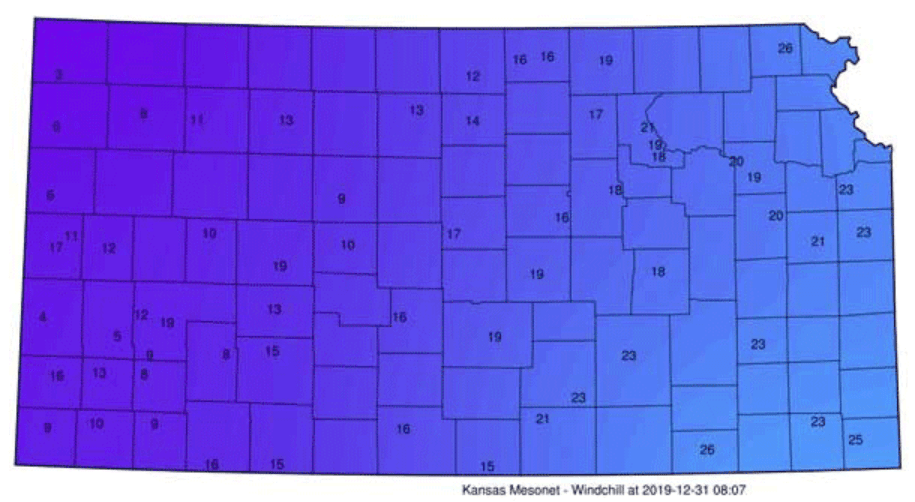
The Kansas Mesonet makes viewing the wind chill very easy! We have put together a webpage depicting the current wind chill via a gradient map here: https://mesonet.k-state.edu/weather/windchill/. It can also be accessed via the menu in the top left (Menu à Weather à Wind Chill)
The map defaults to the current wind chill but also has a selection at the top where you can change the map to view temperature and wind speed/direction. Since these are the two ingredients for the wind chill, it tells the complete story. The table below the map also displays each station’s wind chill, temperature, and wind data in sortable columns. By clicking the column headings, that particular column will sort from lowest to highest values. Click it again, and it will reverse the order. You can also select a specific station either on the map or in the data table, and it will display the specific information for that location.
How many hours has the temperature been below freezing?
Winter wheat and cover crop producers still have an interest in the cold temperatures. The freeze monitor data is available on our webpage as well. It allows you to track the hours below 32 or 24oF thresholds useful for permafrost development or winter wheat/cover crop damages. You can access this information via the menu in the top left (Menu > Weather > Freeze Monitor) or at mesonet.ksu.edu/weather/freeze

Stay warm and safe on these chilly days! Winter has only just begun.
