A related tags network on a content site shows the interrelationships between the textual metadata used to label particular images (or videos). A content network may be built around a particular search term. The tags are searched on a social media (sharing) platform, and instances of the term are discovered. A graph is then created from the interrelationships between related terms.
Starting a Content Crawl of Related Tags on Flickr
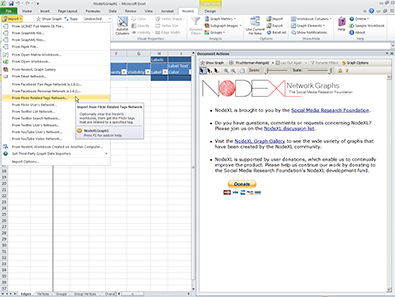
To start a content crawl of related tags on Flickr, start up the NodeXL template. Click on the NodeXL tab to open the ribbon
In the File area, click on “Import” to acquire the dropdown menu. Highlight “From Flickr Related Tags Network…”
The following window will appear. There is a placeholder word, “sociology,” in the search box for tags. Below, there is a required Flickr API key. Clicking on the “Apply for a Flickr API key” link will take you to The App Garden (http://www.flickr.com/services/api/misc.api_keys.html). The Flickr API key may be created using any one of three types of accounts: Yahoo, Facebook, or Google. Once the user’s identity has been linked to an authenticated account, the user will be sent a Flickr API key (a string of alphanumeric characters), a secret alpha-numeric code in case the key is lost, and an identity (based on the account used to validate the individual).
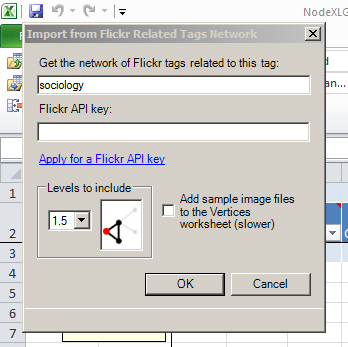
Next, at the bottom left, the user is asked to consider how many levels of the network should be included. A one-degree (1.0 level) crawl involves just the ego neighborhood of the focal node. The 1.5 degree crawl indicates transitivity, or the connections between the alters of the focal node’s ego neighborhood. A degree crawl includes the ego neighborhood, the transitivity of the alters, and the social networks of the alters.
At the bottom right is a check box to enable the addition of a sample image from this photo and video sharing site. (The addition of this feature will add to the time needed to achieve the crawl.)
Once the tag search term, Flickr API key, levels of the network, and preference for the inclusion or exclusion of the sample images has been created, click “OK.”
Crawl Parameters
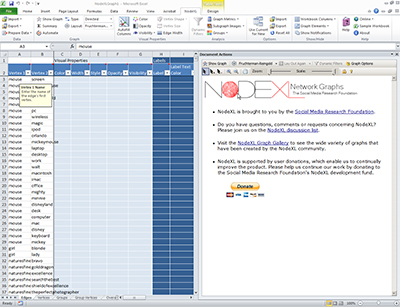
In this case, I used the term of a word which may indicate computer coding, a reptile, or other potential contents, in order to see how Flickr’s tag search disambiguates the term in various content clusters. A two-degree crawl was chosen. No images were requested to expedite the crawl (data extraction). The extraction takes a few seconds, and the table is populated.
Extracting Graph Metrics
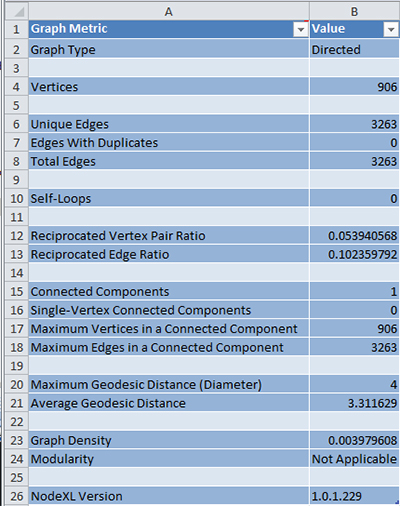
Now, it is time to extract the graph metrics. This involves various computations to summarize this particular network. (Most content networks tend to be fairly small.) In the NodeXL tab, go to the “Graph Metrics” button. A pop-up table will appear with the various choices for network metrics to be placed in the workbook.
![]()
At the top are the selections next to the selection boxes. At the bottom are some basic descriptions of terms. “Select All” is a practical default. Once selections have been made, click on the “Calculate Metrics” button below. A progress bar will show the calculations being analyzed. When the information is ready, the data will be put into a NodeXL table.
Return to the NodeXL tab. Select the Groups button in the Microsoft Excel ribbon.

Select the “Group by Cluster”. Select which of the three clustering algorithms available: Clauset-Newman-Moore, Wakita-Tsurumi, or Girvan-Newman. Click “OK.”
The clustering information will be placed in the “Groups” work sheet.

Creating the Visualization
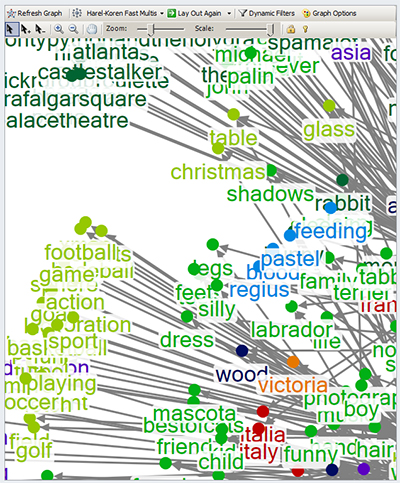
The next step is to create the visualization in the graph pain. Under Document Actions, select the graph layout algorithm type and click “Show Graph.” For this, I chose the Harel-Koren Fast Multiscale Layout Algorithm.
The resulting graph shows various clusters of areas of similar tags based around “python.” There is a fair amount of data draft in terms of breadth of meaning. There seem to be some regionalism effects in the clustering.

The live version of the graph is available on the NodeXL Graph Gallery here.
The interactive version of the graph is available here.
Graph Pane Zoom Function
The graph pane has a zoom function (in either a + or – button, or in a slider bar) for close-in views.
It is said that the informal metadata labeling of images may suffer in part from the lack of training of many amateur photographers. Others suggest that words themselves are ambiguous, and the label has different meanings in different contexts and languages. No matter what the reasons, meaning draft is a part of related tag networks.
Final Note: NodeXL is a free and open-source tool that is available from Microsoft’s CodePlex site (which is a space for project hosting for open-source software), and it is sponsored by the Social Media Research Foundation.