Some graphs and data sets may have value to others. The NodeXL community presents its work through the NodeXL Graph Gallery. This entry will point to the steps required to publish to that gallery.
Exporting to the NodeXL Graph Gallery
For this entry, the data set from the hashtag search for #publichealth will be used. In the NodeXL tab, go to the Export dropdown menu. Highlight “To NodeXL Graph Gallery…”

The “Export to NodeXL Graph Gallery window will appear.
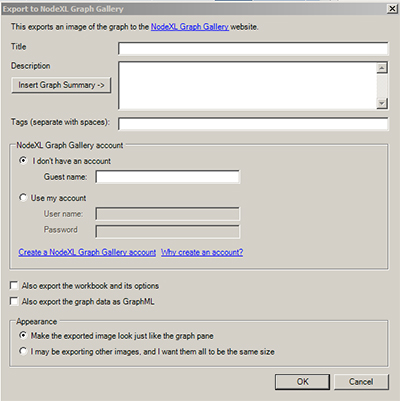
At the top space, write in the title that will be used to describe the graph. For the description, you may click the “Insert Graph Summary” for the insertion of the Graph Metrics. Additional textual data may be written into the Description window.
The “Tags” area should include basic search terms for the graph. Each word is treated as its own tag. (One cannot use commas to separate out phrases.)
Fill in whether you are using a registered NodeXL Graph Gallery account.
Put check marks in the boxes to export the workbook and to export the graph data as GraphML. (The Graph ML extraction enables the creation of the experimental interactive graph on the NodeXL Graph Gallery site.) The finalized form could look like the following.

Then click “OK”.
On the Graph Gallery Site
If all goes well, the graph with the other data will be on the NodeXL Graph Gallery as the newest graph (at the top left).
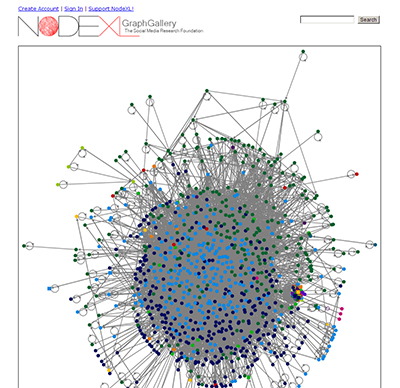
The color graph is available here.
The interactive and zoomable graph is available here.

Be sure to save the workbook again to record the additional post-download data processing information.
Final Note: NodeXL is a free and open-source tool that is available from Microsoft’s CodePlex site (which is a space for project hosting for open-source software), and it is sponsored by the Social Media Research Foundation.