Are you a master’s or doctoral student? If so, it is likely that you will be conducting research as part of your studies. At some point, you may be writing a thesis, report, or dissertation to record your work to share with the profession and the world. K-State has updated templates (in MS Word and LaTeX) for students to use, in order to ensure that they include all required information in the proper formatting.
“Getting Started with ETDR Templates” is an online training on Zoom from 1 – 2:30 p.m. Monday, Sept. 28.
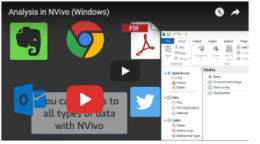
Are you a graduate student who uses digital imagery (photos, data visualizations, and others) in a master’s thesis, master’s report, or doctoral dissertation (in an ETDR application)? Are you a faculty or staff member who integrates photographs into slideshows, imageset, or videos?
“Intro to Adobe Photoshop” is scheduled 1:30-3:30 p.m. Friday, Sept. 25, on Zoom at this URL. This session introduces Adobe Photoshop as the leading software for editing and creating raster images (although it can output vector ones, too). This session will introduce the general graphical user interface (GUI) for this software. Then, it covers some basic uses and shows some walk-throughs of work sequences.
Are you a master’s or doctoral student? If so, it is likely that you will be conducting research as part of your studies. At some point, you may be writing a thesis, report, or dissertation to record your work to share with the profession and the world. K-State has created templates (in Microsoft Word and LaTeX) for students to use, in order to ensure that they include all required information in the proper formatting
“Getting Started with ETDR Templates” is an online training on Zoom from 1 – 2 p.m., Monday, Aug. 31.
“Advanced NVivo 12 Plus/NVivo” is a follow-up presentation from the “Introduction to NVivo 12 Plus/NVivo” offered earlier this term. This training will be held 1:30-3:30 p.m. Friday, Aug. 14, online via Zoom. (The link will not be live until the event.)
This presentation will address the following:
Any extant questions from the basic introduction of NVivo 12 Plus
How to set up qualitative data to be explored and queried
How to use the software on interview, survey, focus group, and similar data
How to query the collected data in an NVivo project (word frequency counts, text searches, matrix coding queries, matrix queries, proximity text searches, and other forms of text parsing)
How to create data visualizations (word trees, word clouds, dendrograms, ring lattice graphs, sociograms, and others) (for analysis and presentations)
How to conduct four types of auto-coding (by extracted themes and subthemes, by sentiment analysis, by structured data, and by supervised machine learning based on existing human coding)
How to set up a qualitative cross-tabulation analysis
How to output a basic report (including a custom codebook)
“Advanced NVivo 12 Plus” is a follow-up presentation from the “Introduction to NVivo 12 Plus” offered earlier this term. This training will be held 1:30-3:30 p.m. Friday, Apr. 10, online.
“Tapping Social Media Data with NCapture and NVivo 12 Plus” will be offered 1:30-3:30 p.m. Friday, Mar. 27, on Zoom. This presentation provides an overview of the NCapture browser add-on (to Google Chrome and Microsoft IE) as a tool for extracting information from social media platforms and will explore how the extracted data is analyzed using NVivo 12 Plus, a qualitative and mixed methods data analysis tool. (The NVivo for Mac now enables this functionality as well.)
An “Intro to NVivo 12 Plus” training is scheduled from 1:30-3:30 p.m. Friday, Mar. 13, in 306 Calvin Hall for all faculty, graduate students, and staff who may be using this qualitative (and mixed methods, multimethods) data analysis tool.
This presentation, which covers NVivo 12 Plus basics, will address the following:
The basic parts of the NVivo 12 Plus interface
How to start and structure a research project (including a team project)
How to set up a project around a base language (Chinese/PRC, English/US, English/UK, French, German, Japanese, Portuguese/Brazil, and Spanish
How to ingest various multimedia file types (and curate heterogeneous and semi-structured digital data and digitized contents)
How to ingest some social media contents
How to begin manual and/or automated coding various media file types
How to run data queries in the tool and analyze resulting data visualizations (word clouds, word trees, matrices, geographical maps, bar charts, and others)
 Are you a master’s or doctoral student? If so, it is likely that you will be conducting research as part of your studies. At some point, you may be writing a thesis, report, or dissertation to record your work to share with the profession and the world. K-State has updated templates (in MS Word and LaTeX) for students to use, in order to ensure that they include all required information in the proper formatting.
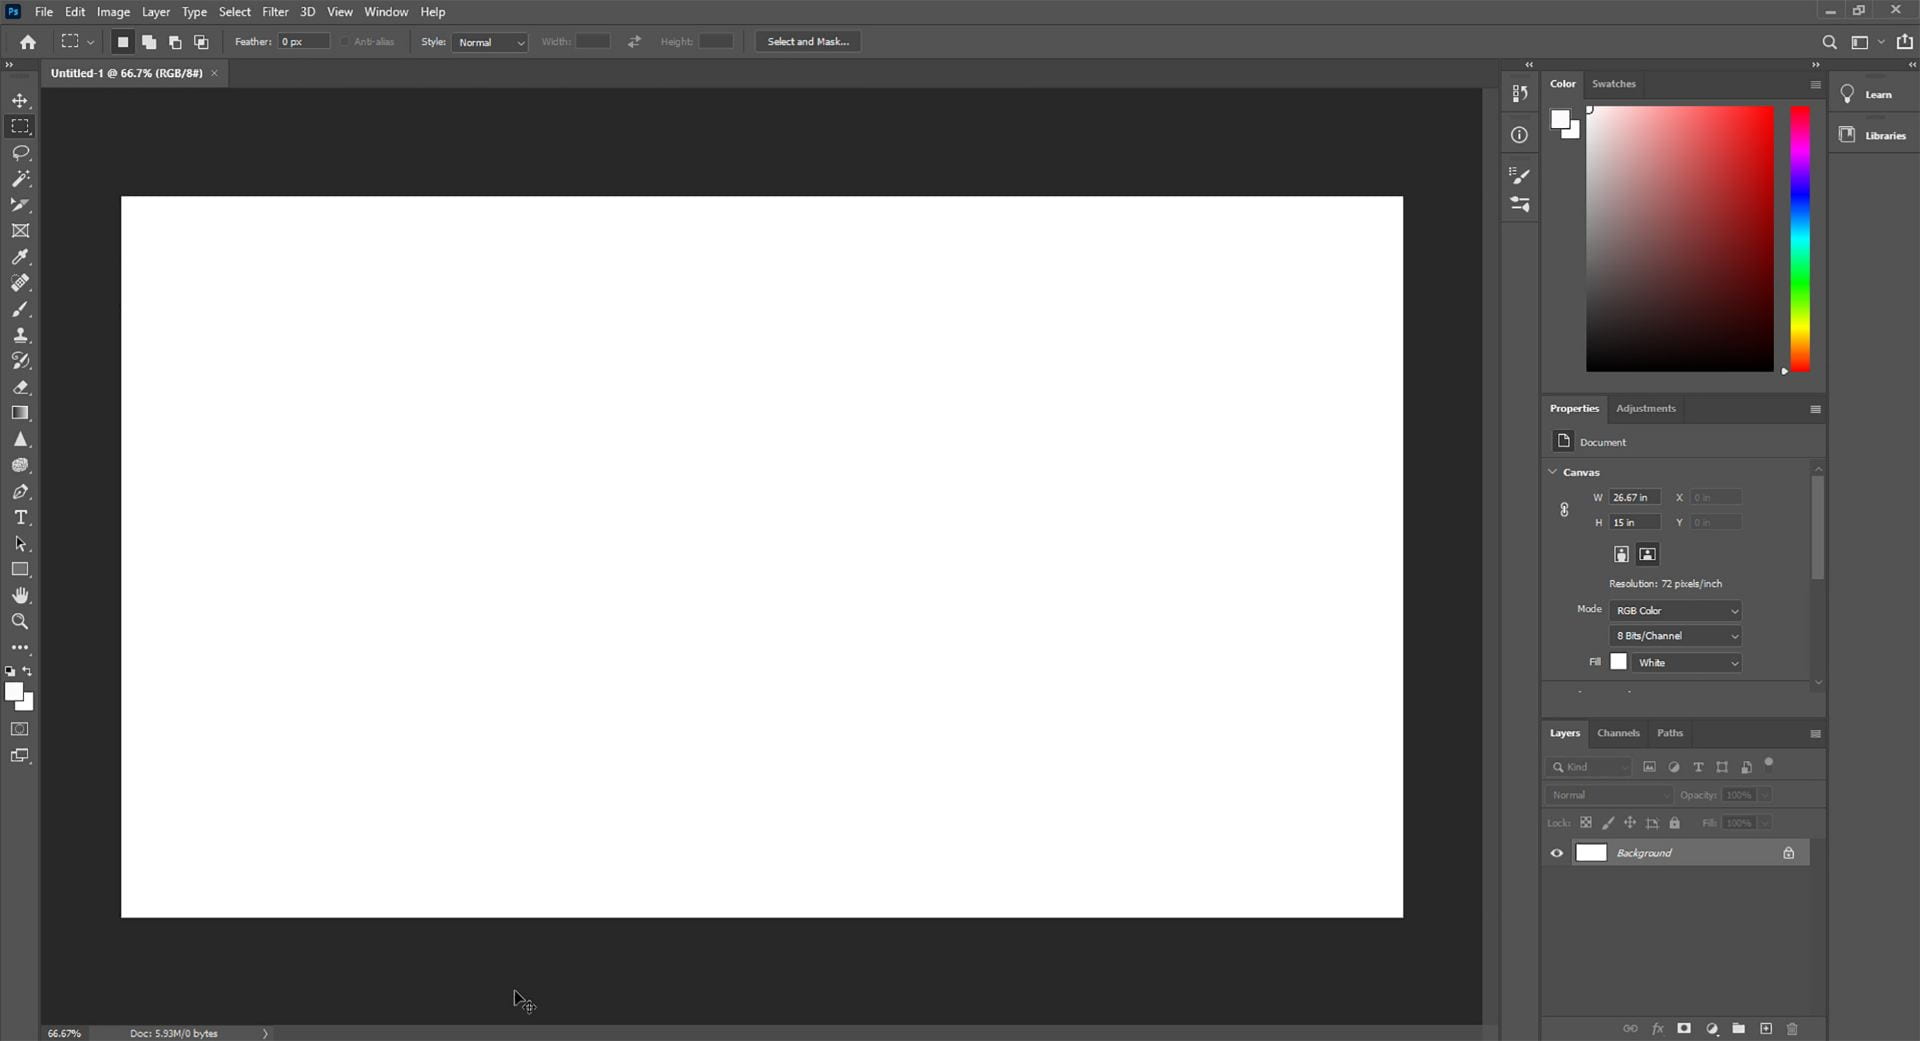

 An introductory training for Microsoft Visio Pro is scheduled 1:30-3:30 p.m. Friday, July 30, on
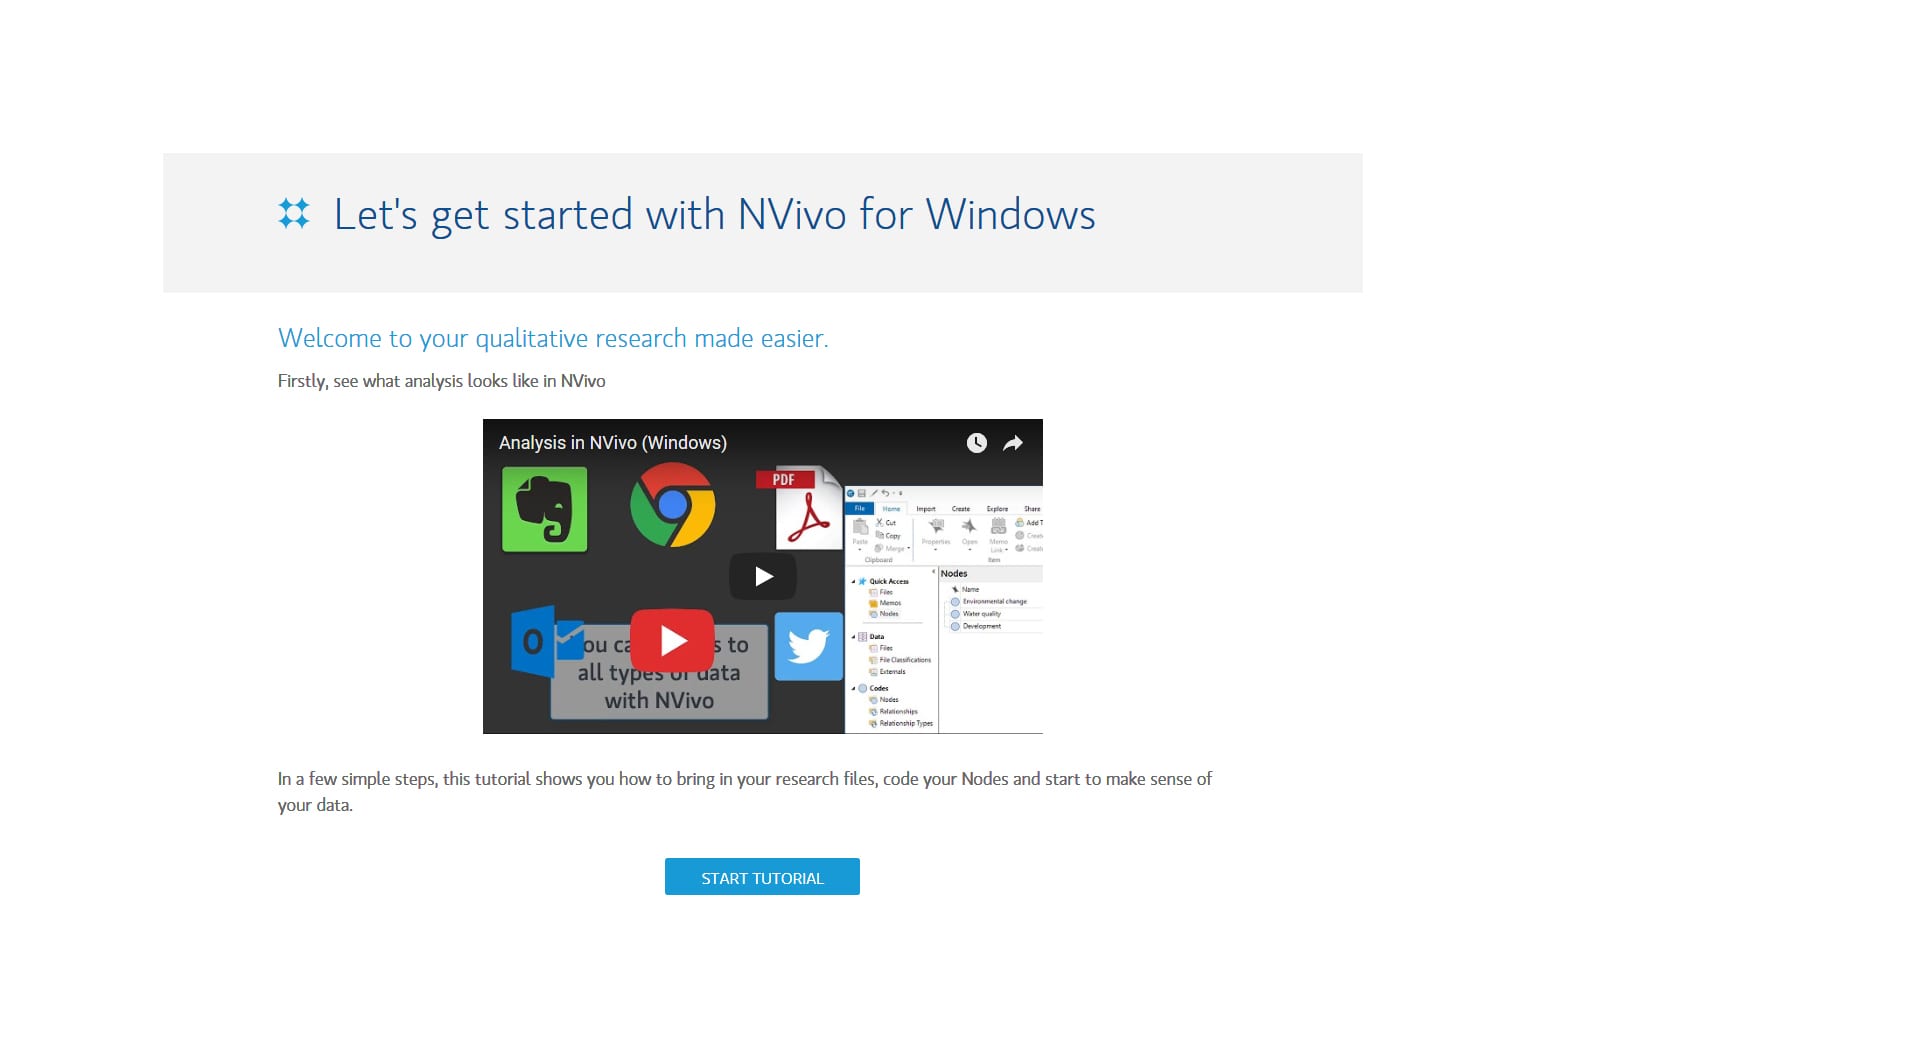
 An “Intro to NVivo 12 Plus” training is scheduled from 1:30-3:30 p.m. Friday, Mar. 13, in 306 Calvin Hall for all faculty, graduate students, and staff who may be using this qualitative (and mixed methods, multimethods) data analysis tool.
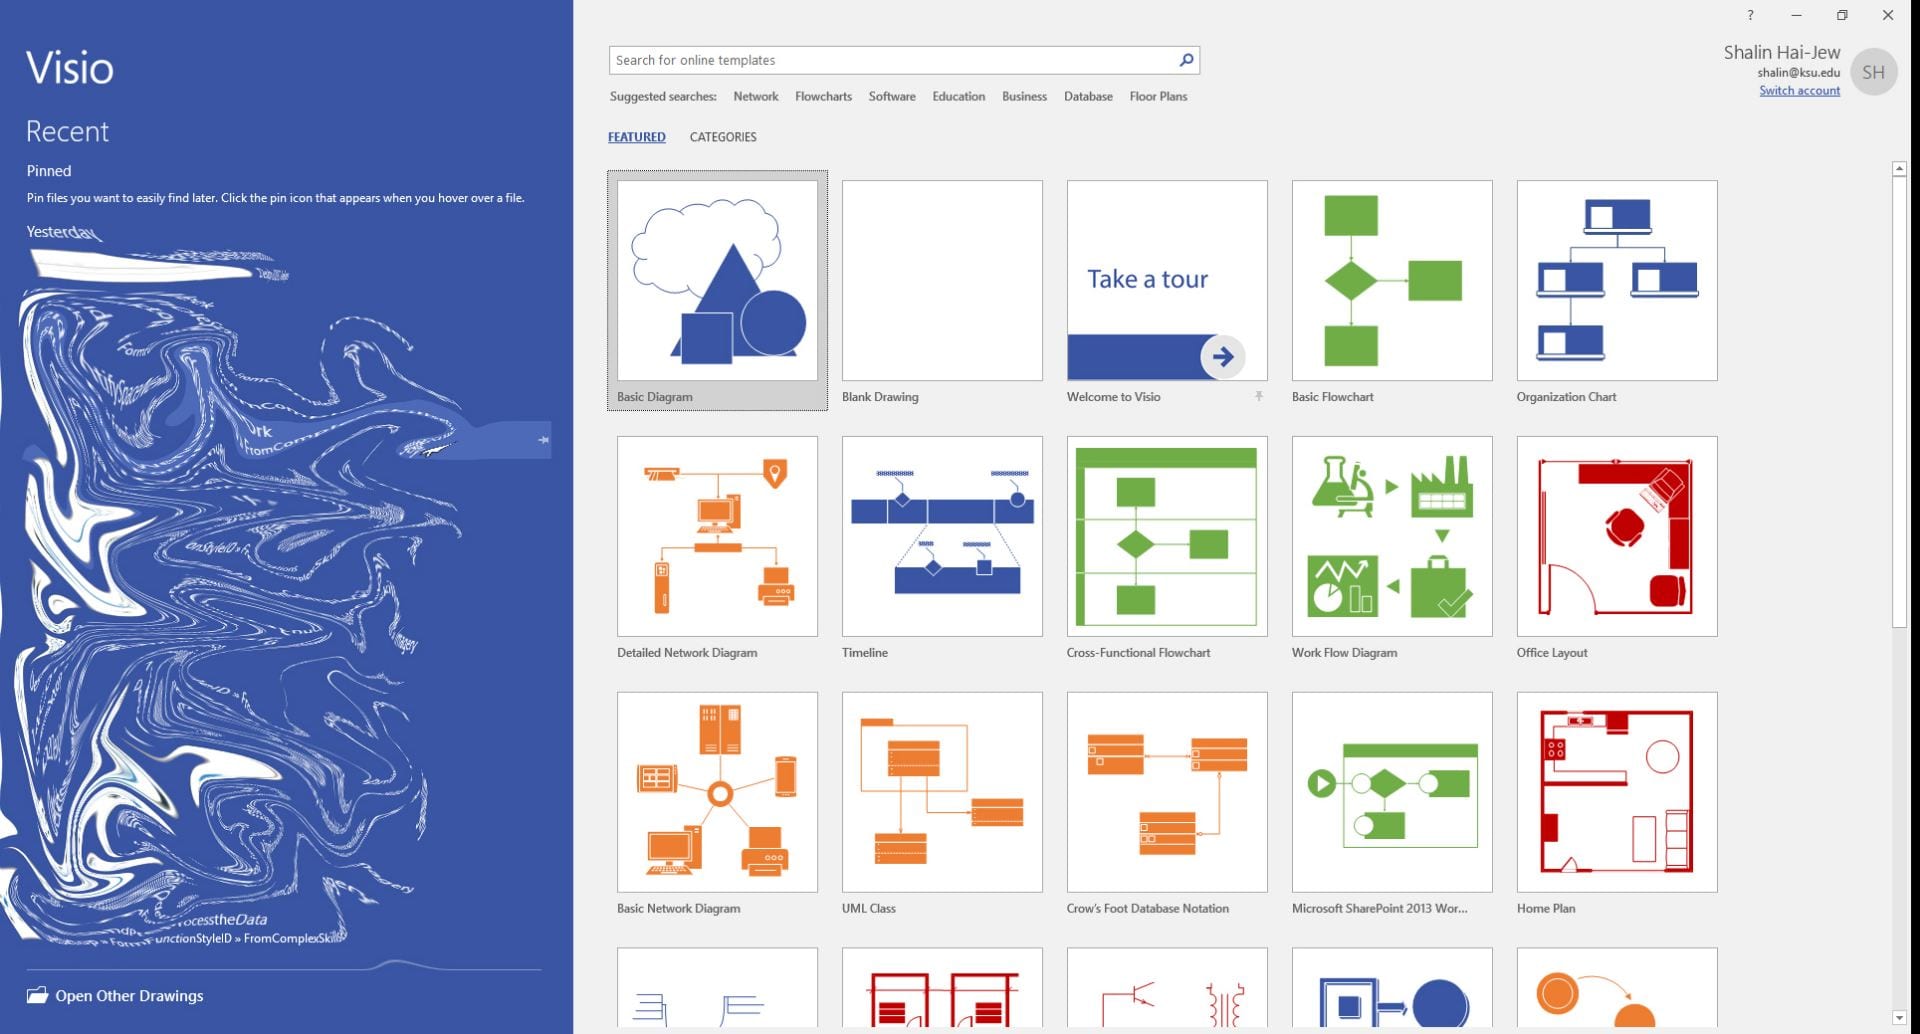
 An introductory training for Microsoft Excel is scheduled 1:30-3:30 p.m. Friday, Feb 7, in 306 Calvin.