The interactive SI Toolkit is here! The SI Toolkit is a dynamic, online platform designed to aid researchers and development workers in assessing sustainable agricultural intensification across five  domains: productivity, economic, environmental, human condition, and social. Users can navigate the SI Toolkit to select appropriate indicators and metrics and visualize tradeoffs and synergies using the Radar Chart Generator. The idea behind this tool is to provide people with indicators that will allow them to assess an innovation in terms of eventual consequences, both direct and indirect. Additionally, the tool aims to make sure those innovations and their eventual goals are treated holistically, thereby increasing the odds of continuing the practices in a sustainable way. The SI Toolkit was developed by SIIL management entity researchers: Zach Stewart, Jan Middendorf, and Vara Prasad building from the Sustainable Intensification Assessment Framework Guide and Manual developed by Mark Musumba, Philip Grabowski, Cheryl Palm, and Sieglinde Snapp. The SI Toolkit was formally launched in Baltimore, Maryland on November 5, 2018 during the Agronomy Society of America’s annual meeting. The launch included a symposium organized by SIIL titled, “Scaling of Sustainable Agricultural Intensification Practices” and a live demo of the SI Toolkit.
The Framework has six steps that are meant to engage users on multiple levels:
- Engaging Stakeholders: identifying stakeholders, objectives; and possible outcomes an intervention or innovation might have
- Selecting Indicators: sele
cting appropriate indicators for intervention/innovation objectives - Identifying Critical Tradeoffs and Synergies: identifying and evaluating tradeoffs/collaborations and revision of indicators as necessary
- Selecting Metrics: deciding how to measure each indicator based on resources and human capital, assigning importance to each indicator, and identifying quantification methods
- Visualizing: data collection and analysis, overall plan visualization
- Sharing and Reflection: data distribution to stakeholders and critical reflection of overall intervention implications based on previous steps
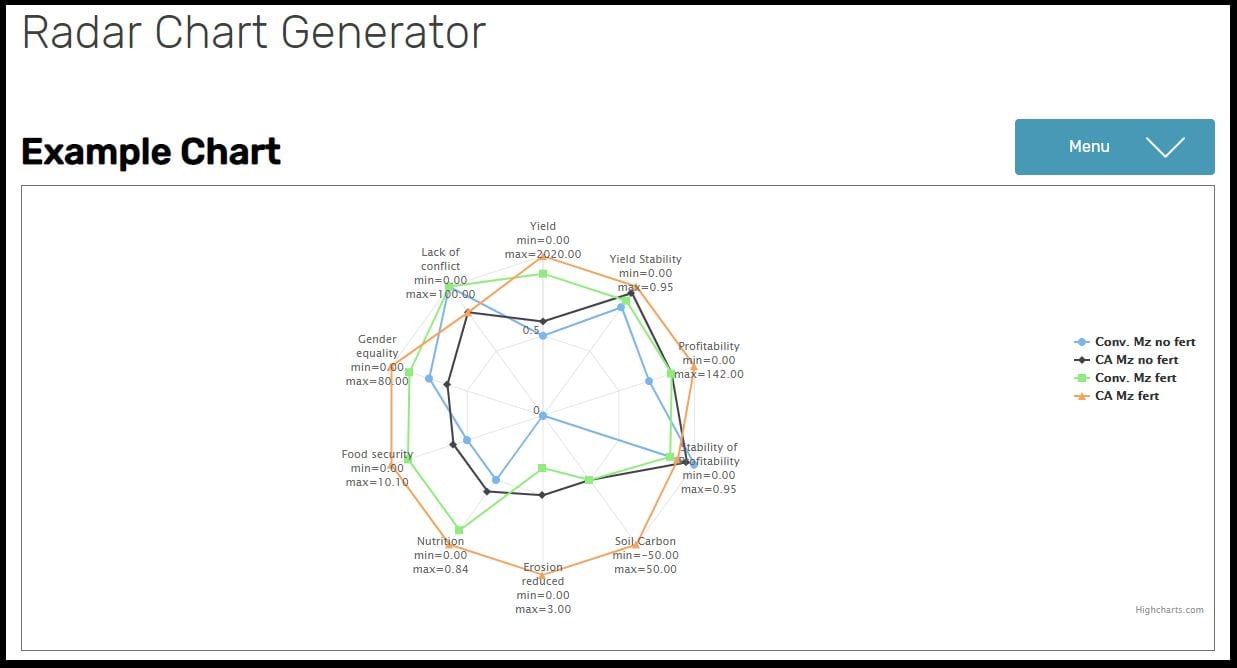
Additionally, the SI Toolkit includes a Radar Chart Generator, designed to visually compare different innovations across the five domains. This is especially effective when sharing outcomes and planning next steps.
For more information on the SI Toolkit, including the Framework and the Radar Chart Generator, please click here.


