One of the foremost website-analysis tools is Google Analytics, a free tool that may be placed on a server to monitor the site’s traffic from around the world.
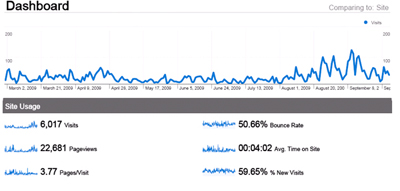
The report itself offers a visual dashboard of trend-lines over time based on the number of visits. There are also actual numbers reflected.
A technical profile shows which browsers were used to arrive at the site as well as the connection speed of site visitors. This helps site designers decide what sorts of content to deliver in terms of the required speed to access or download the content. (For example, simulations, videos, and narrated slideshows may require high bandwidth for access.) A sample of a technical profile is shown below.

A section on traffic sources show how people arrived at a site and what words were used in the search. Some site visits are direct, with users coming upon the site. Others are based on keyword searches. Others are linked directly to the site from other (friendly) sites.
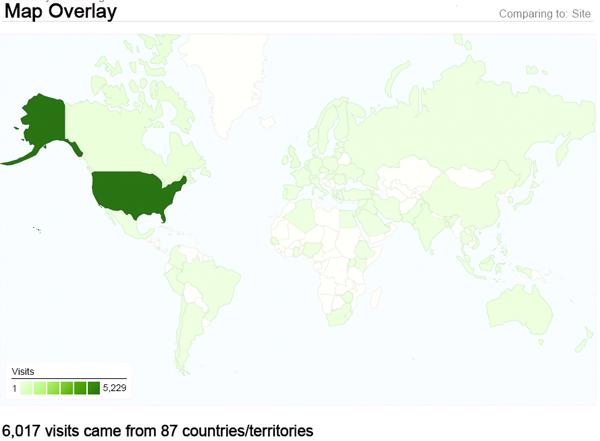
A map overlay shows the countries where visitors come from to a site.

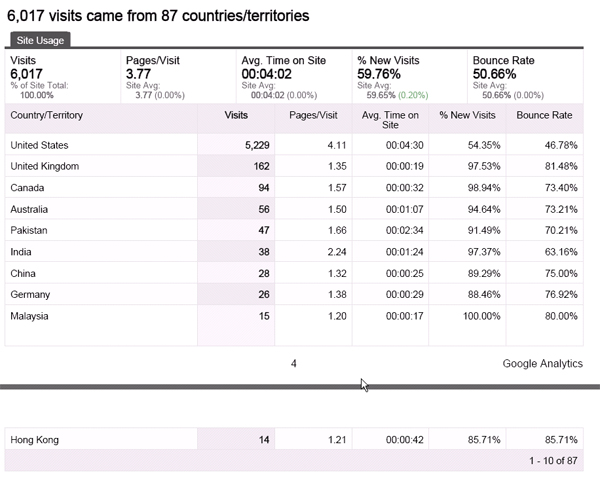
More specific information about site usage is below.

An overview of content helps the web development team see where people went for pageviews, which shows what content is the most popular.
The report uses tables, pie charts, and other informational communications tools. This report may be exported as a .pdf file for sharing with others. A number of people (with Gmail accounts) may be signed up for report access for a particular site.
Downloading the Google Analytics Tool
To use this tool, you will need a Google Mail (Gmail) electronic mail account.
You will also need a system administrator / system operator with access to the server hosting the website in order to set up the Google Analytics tool there.
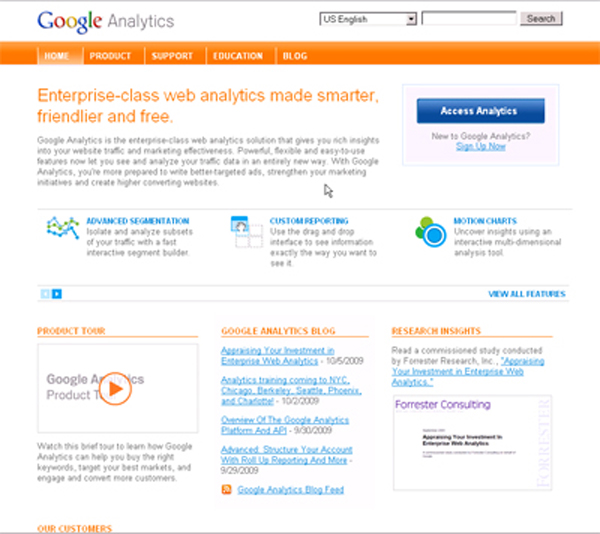
To download this free tool, go to www.google.com/analytics.
A product tour of the Google Analytics tool is available at www.google.com/analytics/tour.html.

