An “event graph” is an emergent social network that is created based on how people interact with each other on a microblogging (or short messaging service) site surrounding an event or conference. An “event graph” in academia usually refers to a presentation or conference around which a particular hashtag is used to identify Tweets specific to that conference. Oftentimes, the backchannel chatter is captured as part of the digital artifacts from that conference and stored as part of the digital poster sessions.
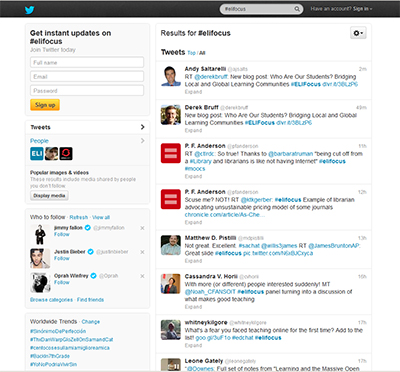
An Educause-sponsored spring focus session was held about MOOCs in early April, and participants to this online conference were asked to use #elifocus to help channel the discussion. Some of the contents of that discussion may be seen here.
Mapping an EventGraph
To capture an event graph from Twitter, start up the NodeXL Excel Template. Click on the NodeXL tab to access the ribbon. Click “Import,” and in that dropdown menu, select “Twitter Search Network.” In the search area, use #elifocus as the search term. All relationships that may be mapped were selected. No limit was placed on the numbers of persons in the network. A Tweet column was not captured for the Edges worksheet, and a statistics column was not added to the vertices worksheet. This was a simple crawl.
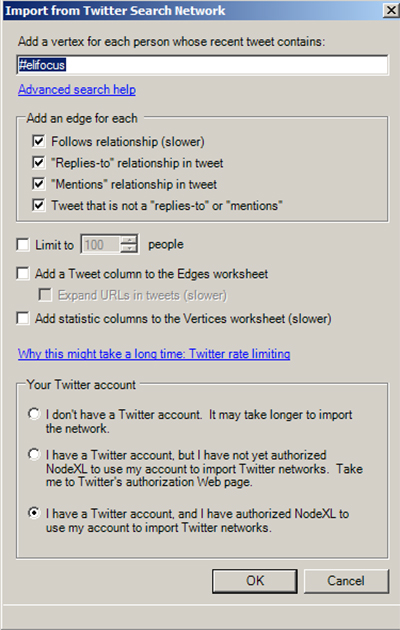
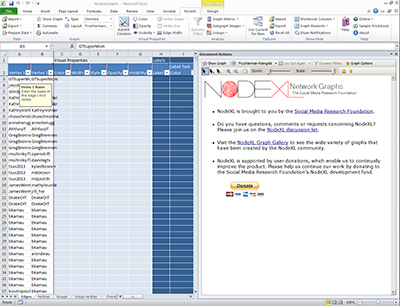
The crawl is conducted expeditiously (as most hashtag crawls are because of the sparseness of the data). The following is a screenshot of the populated NodeXL Excel Template workbook.
Calculating Graph Metrics and Clusters
Graph metrics were run on the work sheet.
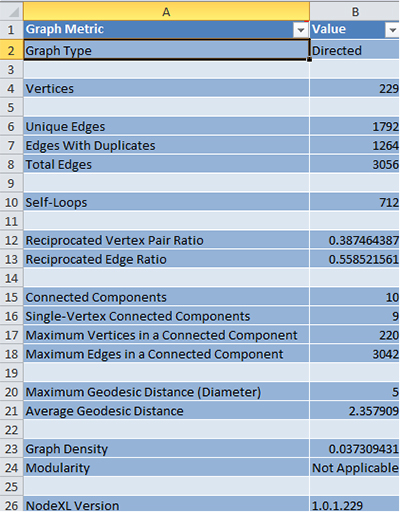
This crawl identified 229 persons in this network, with 1,792 unique edges (links), and 1,264 edges with duplicates (multiple interactions between established nodes). The maximum geodesic distance (diameter of the network) was 5. The average geodesic distance between any two nodes was 2.36 hops.
Grouping by cluster found 16 clusters or groups.

Graph Visualizations
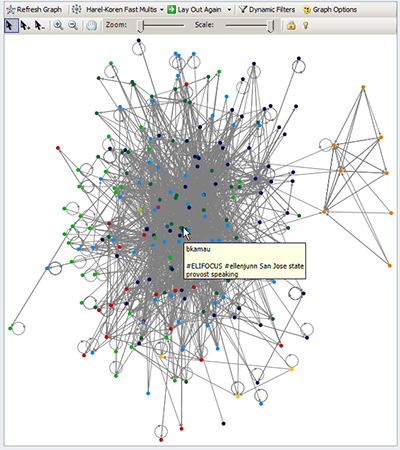
A Harel-Koren Fast Multiscale graph shows a core clustering of intense participation as well as side conversations on the periphery. Some of the participants are high-level communicators with intense messages going back and forth. When the cursor of the mouse was placed on this visualization, both the Tweeter and the microblogged Tweet (the 140-character maximum message) are shown.
A zoomed-in view of the same graph may highlight relationships in a more close-in way.

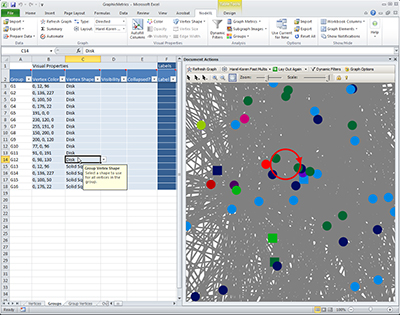
A particular cluster or relationship may be highlighted by selecting a particular cluster to showcase.
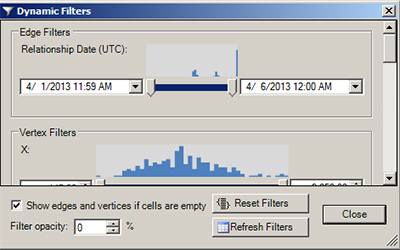
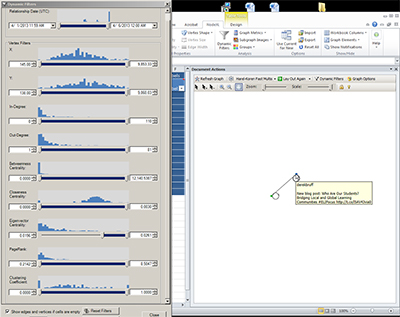
A click on the “Dynamic Filters button shows that this capture of #elifocus occurred from April 1 – April 6, 2013. The graph may be re-visualized based on changes to the time or other parameters.
When the “Dynamic Filters” window is stretched, various data features may be visualized based on filters expressed through the slider bars.
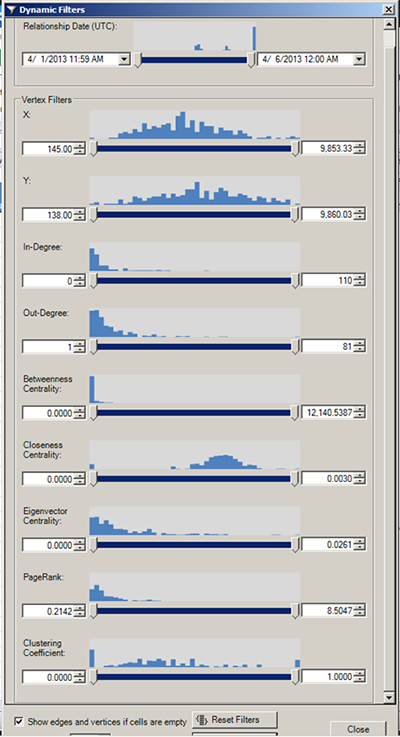
For example, the graph visualization may be changed if Eigenvector Centrality was pushed to the extreme…and only two core relationships would be identified in this eventgraph, that between Derek Bruff and Athlwuf. This ability to probe the data in NodeXL may be used to benefit research and fine-tuned awareness.
Finally, to bring this back to the macro view, the eventgraph in the following area is depicted as a spiral graph.

The online version of the spiral is available here.
The interactive spiral created using GraphML via the NodeXL Graph Gallery may be seen online.

Multiple Streams of Information
This blog entry depicted the capturing of an eventgraph, a sociogram depicting the individuals who participated in backchannel conversations via Twitter related around a professional online conference.
Finally, it’s helpful to note that network analysis is seldom ever used as a stand-alone method to understand people and their relationships and activities. This is one analytical tool and channel for information. Quite a few channels must be made for accurate information capture and understanding.
Final Note: NodeXL is a free and open-source tool that is available from Microsoft’s CodePlex site (which is a space for project hosting for open-source software), and it is sponsored by the Social Media Research Foundation.