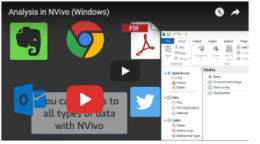
 An “Intro to NVivo 12 Plus” training is scheduled from 1:30-3:30 p.m. Friday, Mar. 13, in 306 Calvin Hall for all faculty, graduate students, and staff who may be using this qualitative (and mixed methods, multimethods) data analysis tool.
This presentation, which covers NVivo 12 Plus basics, will address the following:
- The basic parts of the NVivo 12 Plus interface
- How to start and structure a research project (including a team project)
- How to set up a project around a base language (Chinese/PRC, English/US, English/UK, French, German, Japanese, Portuguese/Brazil, and Spanish
- How to ingest various multimedia file types (and curate heterogeneous and semi-structured digital data and digitized contents)
- How to ingest some social media contents
- How to begin manual and/or automated coding various media file types
- How to run data queries in the tool and analyze resulting data visualizations (word clouds, word trees, matrices, geographical maps, bar charts, and others)
- How to back up the .nvp / .nvpx project file