(Editor’s note: This is the first in a series about faculty demonstrations scheduled for the Innovations in Teaching and Learning Conference March 4-5 at K-State. See the conference schedule and details at theitl.org.)

Mitch Ricketts, a graduate K-State faculty member and administrator, will present “Illustrating Educational Concepts: How to Create Custom Drawings, Animations, and Videos Using Simple Technology” at the Innovations in Teaching and Learning (ITL) conference 1:30-2:30 p.m. Monday, March 4, in the Union Flint Hills Room. Many educational concepts are easier to understand when illustrated with vivid examples. He will explore methods for creating visual instructional materials using simple tools such as PowerPoint, basic photographic equipment, and free software. Bring a laptop, if you wish, and try the techniques as they are discussed.
Please explain your work as a Health, Safety and Environmental Quality Coordinator. What do you do exactly?
My primary responsibility is to help reduce workplace injuries and illnesses among employees and students in the College of Agriculture and at Research and Extension sites throughout the state. Thus, I spend much of my time providing training, technical assistance, and other safety-related services to our faculty and staff. Another part of my job is to provide safety and health training to external audiences at Extension events in agriculture and industry. Additionally, I teach several undergraduate and graduate-level courses, including one face-to-face class (HORT 582) and three distance classes (GENAG 711, 712, and 721).
How did you come to realize the importance of illustrating concepts for learning?
When I first began teaching and training about 30 years ago, there weren’t many sources of helpful instructional images in my field. As a result, my earliest instructional approaches relied heavily on printed and spoken words. These purely verbal methods seemed to work reasonably well for teaching the best-prepared students (e.g., those with prior knowledge of the discipline and those with exceptional language comprehension abilities). On the other hand, I was often disappointed with the impact my lessons were having on students who were new to the field and those who had limited English skills. These learners sometimes expressed confusion in class, and a few of them even suggested I supplement my class materials with pictures, drawings, and practical application exercises. From that point, I became very interested in using images, scale models, hands-on problem-solving, and lab/field activities to create learning experiences that are concrete and meaningful—regardless of learners’ prior knowledge and verbal abilities.
Eventually, I became acquainted with the work of researchers such as Richard Mayer, Peter Houts, Paul Austin, and Chris Delp, who—along with others—have provided strong experimental evidence that people usually do learn better from a combination of words and images, rather than words or images alone. After becoming familiar with this research, I now try to model my own instructional images on some of the educational principles advocated by these scholars.
What are the steps you take in creating illustrations for learning?
Some of my illustrations depict purely physical phenomena. For instance, Figure 1 illustrates some simple processes involved in one type of nuclear reaction. The images in Figure 1 consist entirely of ovals, trapezoids, and other standard geometric objects in PowerPoint’s “Shapes” menu. For illustrations such as this, I just click to insert the desired shapes, then I alter those shapes by stretching, re-coloring, shading, adding soft edges, etc. with the PowerPoint menus labeled “Shape Fill,” “Shape Outline,” and “Shape Effects.” Drawings such as this can usually be completed in less than an hour.
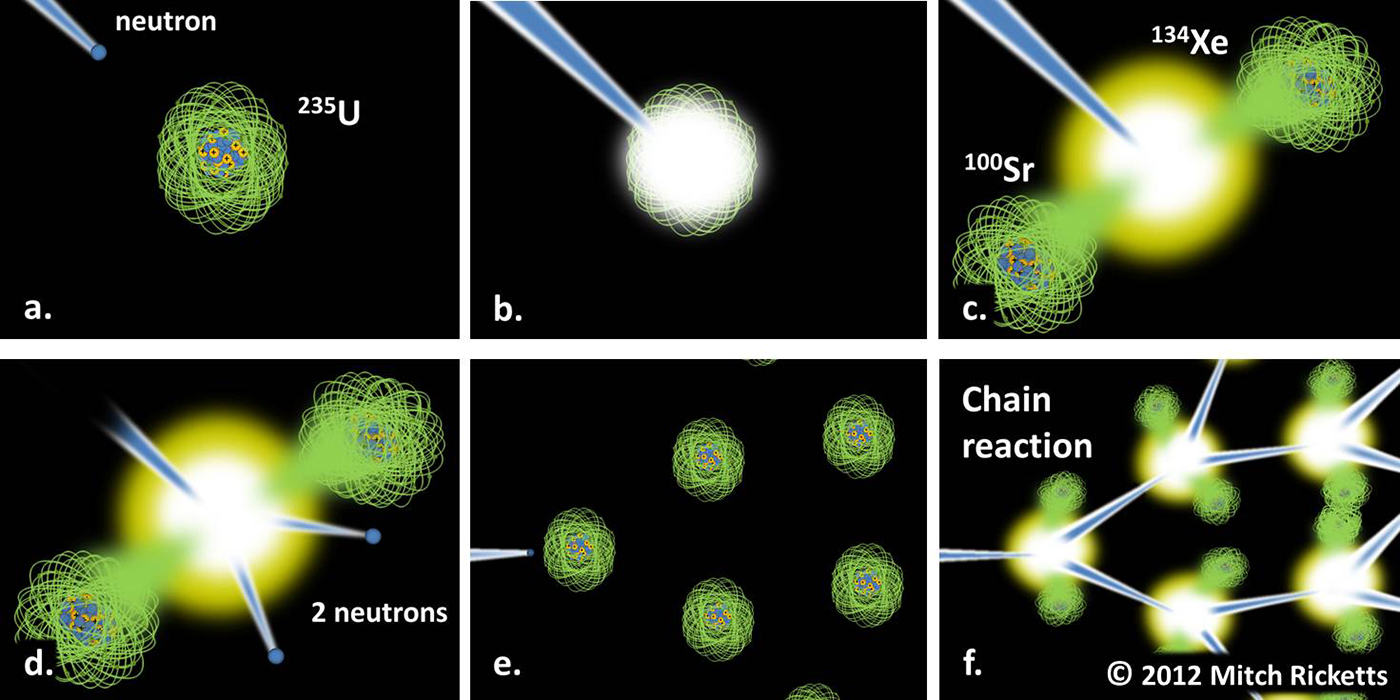
(Note: Please click on the images for larger versions.)
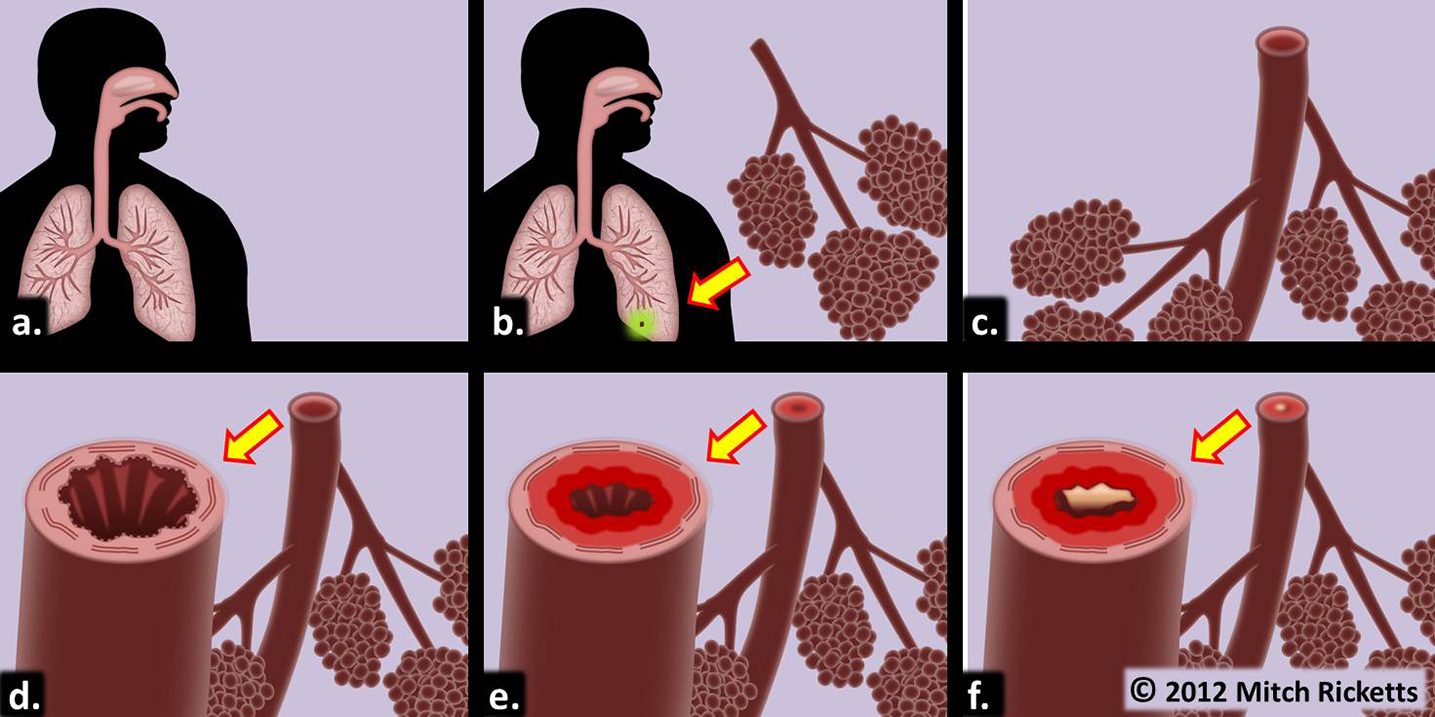
Other illustrations involve anatomical or biological concepts that are harder to depict with the standard PowerPoint menu of shapes. For instance, Figure 2 shows a human silhouette along with some anatomical detail of the airways. These are drawn mainly with the “Curve” and “Freehand” tools in PowerPoint. I’m not an artist, so I usually begin with a photo and trace over the parts of the image I wish to use. I then add color, shading, etc. as described above. Figure 2 represents about 2-4 hours of work.
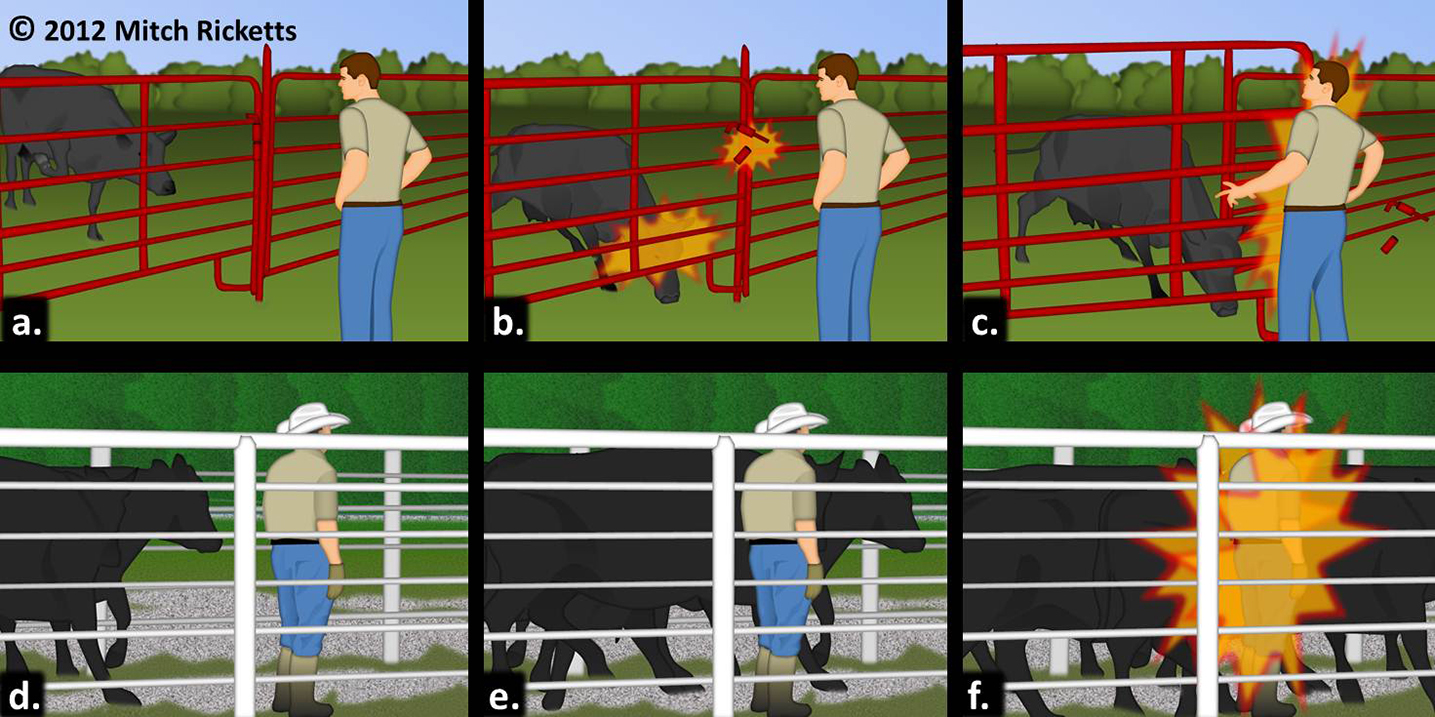
Finally, some of my illustrations depict scenes of humans interacting with hazards in the environment. Since I work in safety and health, these scenes usually don’t end well for the main characters. In the case of Figure 3, I traced photos of cattle and workers. Then I drew gates, fences, and backgrounds using standard PowerPoint shapes along with some freehand drawing where needed. I then copied and pasted these components into the final images. (I never allow people to pose for me in hazardous situations. Instead, I photograph them in safe locations and then combine the images to depict hazardous scenes.) Figure 3 required about 6 hours of my time.
Where do you find inspirations for such illustrations?
I usually start by thinking about the concepts I want students to learn. Then I think about how the class might explore those concepts in a meaningful way (e.g., as full class discussions, as in-class team assignments, as individual homework problems, or as the context for a lab or field experience). Then I begin searching journals, textbooks, and databases for epidemiological data, case studies, and other information that can be incorporated into the learning activity. During the final planning of my illustrations, I usually try to incorporate effective aspects of other authors’ illustrations along with a re-creation of the mental images I experienced while exploring the background information.
What are some of the most difficult aspects of such illustrations?
Human faces are hard to draw. So is visual perspective. I’m a tracer, rather than an artist. As a result, my faces can end up looking bizarre unless I limit myself to minimal detail and soften the facial features as much as possible with PowerPoint’s gradients, shadings, and soft edges. To account for visual perspective in complex scenes, I usually take photos from various angles to make sure all components of the final illustration appear consistent with the assumed vantage point. For instance the swinging gate in Figure 3 had to be re-drawn from two different angles to simulate the swinging motion.
How do you use these illustrations in your face-to-face teaching? Your online teaching? Your automated learning endeavors?
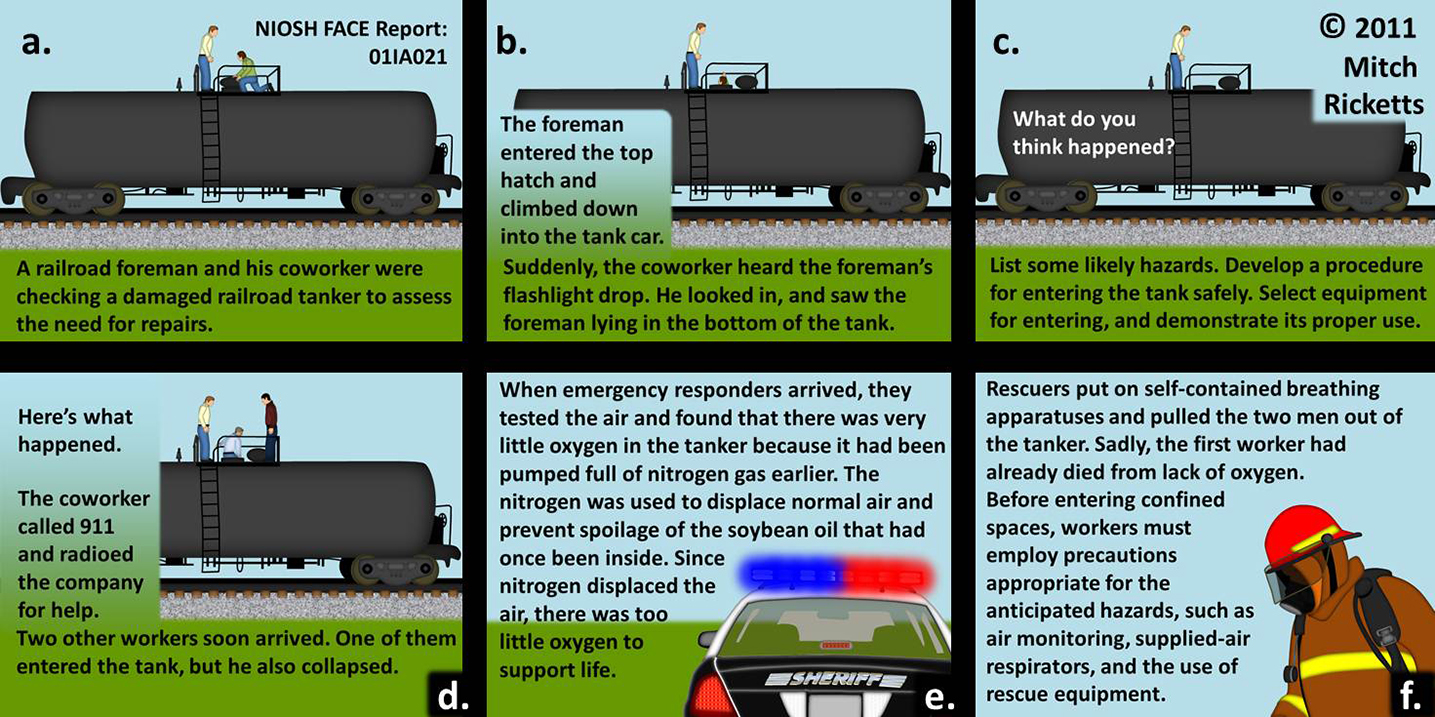
In face-to-face teaching, I will often divide a class into small groups and give each group a case study or problem to solve. These cases and problems commonly take the form of illustrated stories—as in Figure 4. Some of the learning activities are mental exercises, and each group simply reports back to the class by describing their problem and discussing how they solved it. Other exercises involve hands-on components, and the students include a skill demonstration in their report to the rest of the class.
In online teaching, I often create instructional films that supplement the course readings. Each film typically includes video footage of hazards in actual workplaces, drawings (sometimes animated), and narration. The films are designed to provide concrete examples of course concepts. Interested faculty can view a sampling of some recent instructional films on YouTube:
Falls from Heights http://youtu.be/37n3rddJhvU
Mobile Equipment Safety: Skid-Steer Loaders http://youtu.be/STQ5khnfkUQ
Workplace Injury Control http://youtu.be/n6xON985j-E
Videos can be helpful when students are forming initial understandings of new concepts; however, videos are not very practical as routine reference materials because it is hard to locate needed information quickly in a video. This means it is important to provide printed transcripts so students can underline, jot down their own ideas, thumb through, and focus on relevant information as needed. I always include relevant images in the transcripts. That way, each transcript can stand on its own as an instructional resource. Interested faculty can download a sampling of these illustrated transcripts as PDFs:
Gamma Radiation http://www.ksre.ksu.edu/agsafe/doc13613.ashx
X-Rays http://www.ksre.ksu.edu/agsafe/doc13616.ashx
With respect to the last part of the question—automated learning—my attempts at this are just beginning, so I’ll have to get back to you in a couple of years with my answer.
Do you assess the effectiveness of your educational illustrations? If so, how?
At the present time, I have a couple of questions on my course evaluations that relate to the illustrated instructional materials. Students consistently report that the illustrated materials have been among the most helpful aspects of the courses. I would also like to conduct some theory-based experiments involving instructional illustrations. Unfortunately, I have not found the time to do this yet. (Perhaps some of our faculty and students with similar interests would like to collaborate and conduct research on this topic across disciplines?)
You use yourself in many of the photos you use to create your drawings and scenarios. Do your students ever recognize that it’s you in the images?
When I include drawings of my own face, I usually try to change it enough so it isn’t easily recognizable. However, students and trainees occasionally see through the added moustache or dark glasses and ask if that’s me in an image.
What do you plan to present in your workshop?
My plan is to first give a brief overview of ways we can use simple technologies to create useful instructional images and films. This overview will include PowerPoint drawings, still photos, and videos. After the overview, I’ll ask audience members to identify which of these technologies they’d like to explore in more detail. Majority vote will decide where we go from there, but I hope participants will bring their laptops and camera phones (or other small cameras with USB hookups). That way, we can break into small groups and get some hands-on practice with simple drawings, and/or shoot brief video footage, record short narrations, and maybe even combine some of these components to create a short film using free software such as iMovie, Windows Movie Maker, or the cloud-based Screencast-O-Matic.