Kansas State University

search

IT News

Tag: Excel

Make your Excel data stand out by using conditional formatting

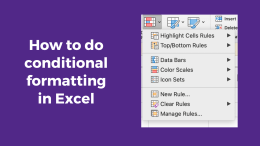
How to do conditional formatting in ExcelExcel is a powerful tool for managing and analyzing data. Conditional formatting allows you to apply formatting to cells based on specific conditions. This can help you identify important information in your spreadsheet and make your data more visually appealing.

How to apply apply formatting

  1. Select the cells you want to apply the formatting to.
  2. On the Home tab, click the Conditional Formatting menu.
  3. Choose a conditional formatting option, such as Highlight Cell Rules, Top/Bottom Rules, Data Bars, Color Scales, or Icon Sets.
  4. Customize the formatting options to suit your needs, such as choosing the color and font style for the highlighted cells.
  5. If necessary, add multiple conditional formatting rules to a range of cells.
  6. Apply the formatting to the selected cells by clicking the OK button.

Note:

  • Highlight Cell Rules: allows you to highlight cells based on their value. .
  • Top/Bottom Rules: allows you to highlight the top or bottom values in a range of cells.
  • Data Bars: allows you to add a data bar to each cell in a range, which visually represents the cell’s value.
  • Color Scales: allows you to apply a color scale to a range of cells, which will change the color of each cell based on its value.
  • Icon Sets: allows you to add icons to a range of cells, which represent the cell’s value.

For more information on conditional formatting, see Microsoft’s Use Conditional formatting to highlight information article.
Enhance your Excel spreadsheets with tables, images and Icons

Microsoft Excel logoMaking your spreadsheets visually appealing can improve readability and make your data stand out. Explore using tables, images, and icons in your spreadsheets.
Use Excel tables for better organization and formatting

Tables in Excel are a great way to organize and present data. They automatically include filtering options, making sorting and analyzing data easier. Tables also come with built-in formatting options that enhance the overall look of your spreadsheet.

Creating a table

  1. Highlight the range of cells you want to convert into a table.
  2. On the Insert tab, click on Table.
  3. After creating your table, use the Table Design tab to select a style that fits your needs. You can choose from a variety of pre-defined styles or customize your own.

Continue reading “Enhance your Excel spreadsheets with tables, images and Icons”

Jan. 28: Exploring Microsoft Excel (Essentials)

Exploring Microsoft Excel (Essentials) training is scheduled 1:30-3:30 p.m. Friday, Jan. 28, on Zoom.  

About Microsoft Excel

Microsoft Excel is the foremost spreadsheet program in use today.

It is commonly used to:

  • Conduct calculations
  • Clean data
  • Graph or plot data (to identify data patterns)
  • Create data visualizations (both static and interactive)
  • Apply visual styles to data tables and data visualizations
  • Create interactive data visualizations (interactive pivot tables, interactive dashboards with sliders, and others)
  • Create simple macros for continuing data handling (with Visual Basic programming language)
  • Process data for analytics in other software programs
  • Enable the share-ability of information
  • Access online survey data (in analyze-able format), and more…

Continue reading “Jan. 28: Exploring Microsoft Excel (Essentials)”

June 3: Exploring Microsoft Excel (Essentials)

Exploring Microsoft Excel (Essentials) training is scheduled 1:30-3:30 p.m. Friday, June 3 (Fri.), on Zoom.  

About Microsoft Excel

Microsoft Excel is the foremost spreadsheet program in use today.

It is commonly used to:

  • Conduct calculations
  • Clean data
  • Graph or plot data (to identify data patterns)
  • Create data visualizations (both static and interactive)
  • Apply visual styles to data tables and data visualizations
  • Create interactive data visualizations (interactive pivot tables, interactive dashboards with sliders, and others)
  • Create simple macros for continuing data handling (with Visual Basic programming language)
  • Process data for analytics in other software programs
  • Enable the share-ability of information
  • Access online survey data (in analyze-able format), and more…

Continue reading “June 3: Exploring Microsoft Excel (Essentials)”

Sept. 3: Exploring Microsoft Excel (Essentials)

Exploring Microsoft Excel (Essentials) training is scheduled 1:30-3:30 p.m. Friday, Sept. 3, on Zoom.  

About Microsoft Excel

Microsoft Excel is the foremost spreadsheet program in use today.

It is commonly used to:

  • Conduct calculations
  • Clean data
  • Graph or plot data (to identify data patterns)
  • Create data visualizations (both static and interactive)
  • Apply visual styles to data tables and data visualizations
  • Create interactive data visualizations (interactive pivot tables, interactive dashboards with sliders, and others)
  • Create simple macros for continuing data handling (with Visual Basic programming language)
  • Process data for analytics in other software programs
  • Enable the share-ability of information
  • Access online survey data (in analyze-able format), and more…

Continue reading “Sept. 3: Exploring Microsoft Excel (Essentials)”

June 10: Microsoft Excel L200 training

""Microsoft Excel L200 training is scheduled 2-3:30 p.m. Thursday, June 10. The session will be presented in Microsoft Teams.

Registration is required. A confirmation message with a link to the session will be sent to you after you register. When you click to join the meeting, you will be taken to a page where you can choose to either join on the web or download the desktop app. If you already have the Teams app, the meeting will open there automatically.

Take a dive into the intermediate features of Excel formatting, functions, and accessibility. Attendees taking this course should have a strong understanding of Excel’s basic features, navigation, functions, and
custom formulas.

Continue reading “June 10: Microsoft Excel L200 training”

June 4: Exploring Microsoft Excel (Basics)

An introductory training for Microsoft Excel is scheduled 1:30-3:30 p.m. Friday, June 4, on Zoom.  

About Microsoft Excel

Microsoft Excel is the foremost spreadsheet program in use today.

It is commonly used to:

  • Conduct calculations
  • Clean data
  • Graph or plot data (to identify data patterns)
  • Create data visualizations (both static and interactive)
  • Apply visual styles to data tables and data visualizations
  • Create interactive data visualizations (interactive pivot tables, interactive
  • dashboards with sliders, and others)
  • Create simple macros for continuing data handling (with Visual Basic programming language)
  • Process data for analytics in other software programs
  • Enable the share-ability of information
  • Access online survey data (in analyze-able format), and more…

Continue reading “June 4: Exploring Microsoft Excel (Basics)”

Jan. 29: Exploring Microsoft Excel (Essentials)

Exploring Microsoft Excel (Essentials) training is scheduled 1:30-3:30 p.m. Friday, Jan. 29, on Zoom.  

About Microsoft Excel

Microsoft Excel is the foremost spreadsheet program in use today.

It is commonly used to:

  • Conduct calculations
  • Clean data
  • Graph or plot data (to identify data patterns)
  • Create data visualizations (both static and interactive)
  • Apply visual styles to data tables and data visualizations
  • Create interactive data visualizations (interactive pivot tables, interactive dashboards with sliders, and others)
  • Create simple macros for continuing data handling (with Visual Basic programming language)
  • Process data for analytics in other software programs
  • Enable the share-ability of information
  • Access online survey data (in analyze-able format), and more…

Continue reading “Jan. 29: Exploring Microsoft Excel (Essentials)”

Sept. 4: Exploring Microsoft Excel (Basics)

An introductory training for Microsoft Excel (essentials) is scheduled 1:30-3:30 p.m. Friday, Sept. 4, on Zoom.  

About Microsoft Excel

Microsoft Excel is the foremost spreadsheet program in use today.

It is commonly used to:

  • Conduct calculations
  • Clean data
  • Graph or plot data (to identify data patterns)
  • Create data visualizations (both static and interactive)
  • Apply visual styles to data tables and data visualizations
  • Create interactive data visualizations (interactive pivot tables, interactive
  • dashboards with sliders, and others)
  • Create simple macros for continuing data handling (with Visual Basic programming language)
  • Process data for analytics in other software programs
  • Enable the share-ability of information
  • Access online survey data (in analyze-able format), and more…

Continue reading “Sept. 4: Exploring Microsoft Excel (Basics)”

Feb. 7: Exploring Microsoft Excel (Basic)

An introductory training for Microsoft Excel is scheduled 1:30-3:30 p.m. Friday, Feb 7, in 306 Calvin.

About Microsoft Excel

Microsoft Excel is the foremost spreadsheet program in use today.

It is commonly used to:

  • Conduct calculations
  • Clean data
  • Graph or plot data (to identify data patterns)
  • Create data visualizations (both static and interactive)
  • Apply visual styles to data tables and data visualizations
  • Create interactive data visualizations (interactive pivot tables, interactive
  • dashboards with sliders, and others)
  • Create simple macros for continuing data handling (with Visual Basic programming language)
  • Process data for analytics in other software programs
  • Enable the share-ability of information
  • Access online survey data (in analyze-able format), and more…

Continue reading “Feb. 7: Exploring Microsoft Excel (Basic)”