CRM Introduction Training has been scheduled for Oct. 31, Nov. 12, and Dec. 2. All training sessions will be in Calvin Hall 306, and training will last for 1.5 hours. Training sessions are limited to 20 people per session. You must be enrolled in the session to attend.
To sign up for training, sign in to HRIS.
- Under Self Service, choose Learning and Development, then KSU Training Enrollment.
- On the Request Training Enrollment page, look for CRM Introduction WIT310.
- Select View Available Sessions.
- Select the Session you would like to attend.
- Select Continue.
Continue reading “CRM introduction training Oct. 31, Nov. 12, and Dec. 2”
 An “Intro to NVivo 12 Plus” training is scheduled from 1:30-3:30 p.m. Friday, Oct. 11, in 306 Calvin Hall for all faculty, graduate students, and staff who may be using this qualitative (and mixed methods) data analysis tool.
 A MATLAB and Simulink seminar is scheduled 2:30 to 4:30 p.m. Wed., Sept. 11, Business Administration Building, Room 1092 (1st floor near Radina’s).
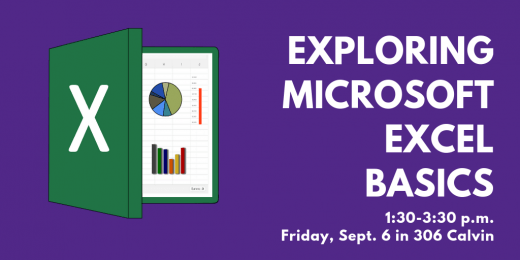
 About Microsoft Excel
 Information Technology Services (ITS) continues to work on targeted projects identified in the
  Graduate School student forms can now be submitted electronically online. To access the forms, go to